Digital Readiness Index: A tool to assess digital preparedness of India’s artisan community
The artisanal ecosystem requires a makeover to reclaim the status of a lucrative business opportunity. To achieve the same, digital preparedness establishes itself as the qualifier for the artisans to gain discoverability for any assistance in the form of capital, market, fintech product, social protection, disruptive technologies and so on. To make the most out of the changing landscape in the field of digital finance and online marketplaces, the artisans need to be digitally ready.
Catalyst AIC, as a part of its research on artisan communities, constructed a Digital Readiness Index (DRI) of artisans across 7 states. The districts were sampled considering NITI Aayog Multidimensional Poverty Index Baseline Report 2021. Through data collected from 1287 artisans characterised by home-based business setup (75.28%) and representative of women(62.42%), it sets forth a tool to study how prepared the artisans are for technologies with great potential transforming other sectors and gradually seeping in the Indian handicraft industry, explicitly for raising the standard of living for the artisans.
What is the Digital Readiness Index (DRI)?
DRI is a tool which holistically captures the digital preparedness of the artisans at individual levels. The index is derived from 10 variables which are representative of enablers of artisan’s empowerment to access the huge market potential which has been restricted due to information asymmetry attributable to lack of digital readiness, further restraining the onboarding coupled with sustained use of digital platforms.
By tracking artisans across the same measures, the scores obtained for the DRI can be a crucial input towards creating products that can plug critical pain points faced by artisans, such as those in market access, supply chain, financial services among others.
At governance level, the index will help identify areas which need intervention in the form of policy driven by evidence.
Methodology Used for Constructing DRI:
- The nature of the study is comprehensive as it is built upon variables categorised into four larger sections: artisanal profiles, use of digital applications, market integration and access to financial capital.
- Multiple Correspondence Analysis(MCA) has been used as the survey instrument is largely characterised by nominal data. Apart from the computational advantage of MCA, the construction of the Index becomes reliable as each variable is not assigned weightage in a random manner.
- Additionally, this methodology fulfils the aim of higher representation of relatively deprived individuals in the study.
Comprehending the Digital Readiness Index
The DRI is constructed as a total score from the individual scores achieved for each of the four Sub-indices. The DRI evaluates the first set of actions to be taken to strengthen the artisans capability in terms of market integration and access to financial services as any kind of future opportunities which cater to their welfare, would require artisans to be sound users of the internet and being well-trained in terms of using the digital applications.
What are the Sub-indices:
- Artisanal Capabilities ii)Access to Digital Assets iii) Use of Digital Channels iv)Payment Mode for Business
Selected variables from the survey instrument which attempts to capture digital readiness of the artisans has been used to calculate four sub-indices.
What do the Sub-indices represent:
- Artisanal Capabilities: Education level, Artisan card, Registration of business
- Access to Digital Assets: Access to internet in mobile phone, amount spent on internet connection, time spent using internet
- Use of Digital Channels: Number of apps used, Whatsapp communication, Use of Facebook marketplace, Instagram page, Use of e-commerce platform
- Payment Mode for Business: Use of payment apps for business
Scores Achieved
i)Total score
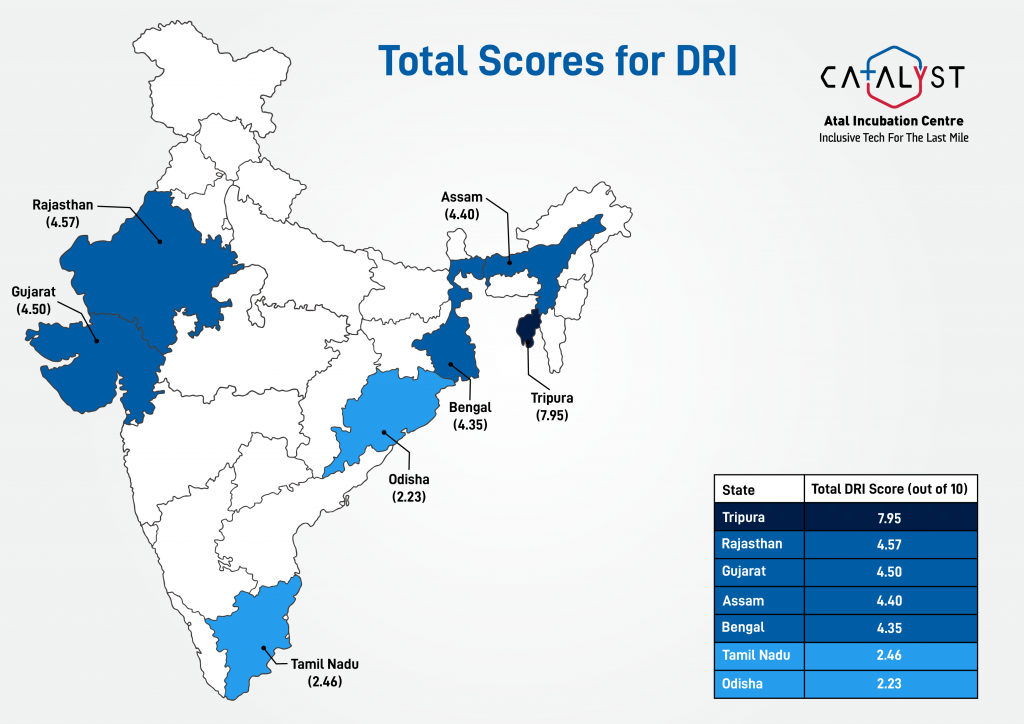
Remark: All scores are out of 10
| Rajasthan | |
| Artisanal Capabilities to access services | 2 |
| Access to Digital Assets | 5 |
| Use of Digital Channels | 7 |
| Payment Mode for Business | 2 |
| Overall Score | 4.57 |
| Tripura | |
| Artisanal Capabilities to access services | 4 |
| Access to Digital Assets | 9 |
| Use of Digital Channels | 7 |
| Payment Mode for Business | 2 |
| Overall Score | 7.95 |
| Bengal | |
| Artisanal Capabilities to access services | 4 |
| Access to Digital Assets | 5 |
| Use of Digital Channels | 7 |
| Payment Mode for Business | 1 |
| Overall Score | 4.35 |
| Odisha | |
| Artisanal Capabilities to access services | 3 |
| Access to Digital Assets | 2 |
| Use of Digital Channels | 3 |
| Payment Mode for Business | 2 |
| Overall Score | 2.23 |
| Assam | |
| Artisanal Capabilities to access services | 2 |
| Access to Digital Assets | 5 |
| Use of Digital Channels | 7 |
| Payment Mode for Business | 1 |
| Overall Score | 4.4 |
| Gujarat | |
| Artisanal Capabilities to access services | 2 |
| Access to Digital Assets | 5 |
| Use of Digital Channels | 6 |
| Payment Mode for Business | 2 |
| Overall Score | 4.5 |
| Tamil Nadu | |
| Artisanal Capabilities to access services | 3 |
| Access to Digital Assets | 2 |
| Use of Digital Channels | 4 |
| Payment Mode for Business | 2 |
| Overall Score | 2.46 |
- Tripura and Rajasthan are noted as the top 2 states with a score of 7.95 and 4.57 respectively out of 10.
- Tamil Nadu and Odisha are at the bottom with Odisha scoring 2.23.
- Aligning with the DRI score, a crucial observation from the research highlighted that the number of artisans falling in the category with higher monthly income from handicraft is highest for Tripura (20%) followed by Rajasthan (12%).
ii) Score achieved across four sub-indices
Sub-index I: Artisanal Capabilities to access services
(A higher score was allocated to artisans who had data points falling under preferable categories.)
1)Education level
Preferable: Formal Education including primary, and graduate.
2)Artisan card
Preferable: Artisan card holders
3)Registration of business
Preferable: Business Registrations including MSME (SSI, UDYOG AADHAR), Business Associations, SHG, NRLM/SRLM.
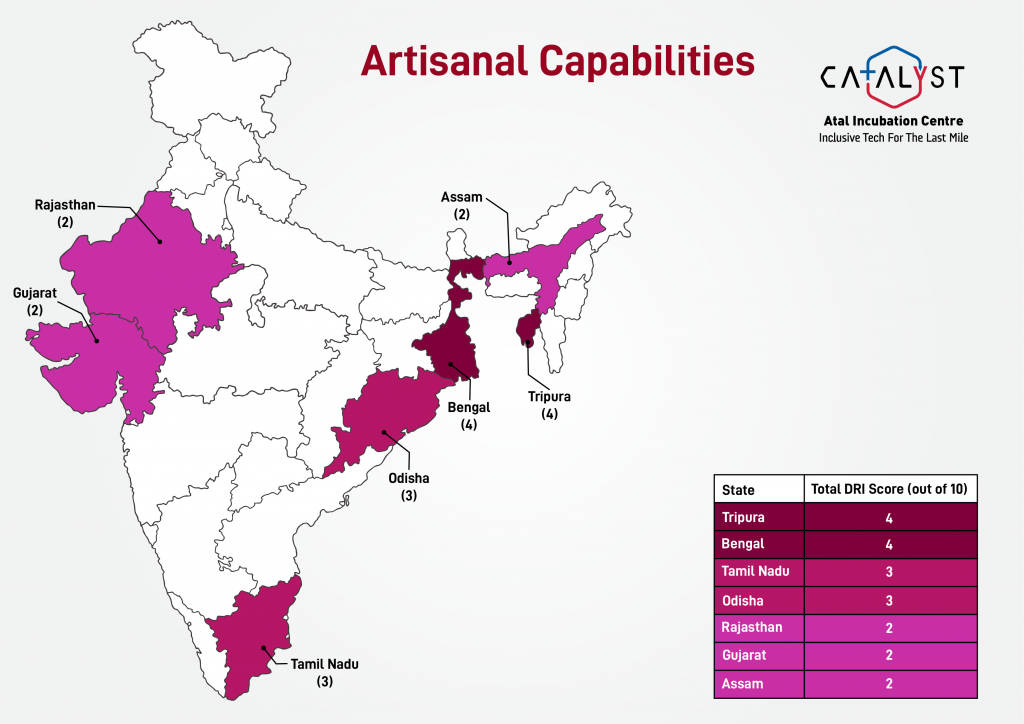
Bengal and Tripura scored the highest for the Artisanal capabilities sub-index.
- The Development Commissioner (Handicraft) issues photo-identity cards to artisans. The card facilitates easier identification of artisans and it acts as an official proof of identity when they deal with various government schemes related to skill-training, access to credit, insurance among the other things. In the study, 26.9% of the artisans had an artisan card, thus reflecting the hindrance at first point of access to services.
- 73% of the artisans had their business unregistered. Udyam registration by MSMEs is essential for availing various benefits of schemes or programmes by the Ministry of MSME such as credit guarantee scheme, public procurement policy.
Sub-index II: Access to Digital Assets
(A higher score was allocated to artisans who had data points falling under preferable categories.)
- Access to internet in mobile phone
- Amount spent on internet connection
Preferable: More than Rs.500 per month
- Time spent using internet
Preferable: More than 2 hours per day
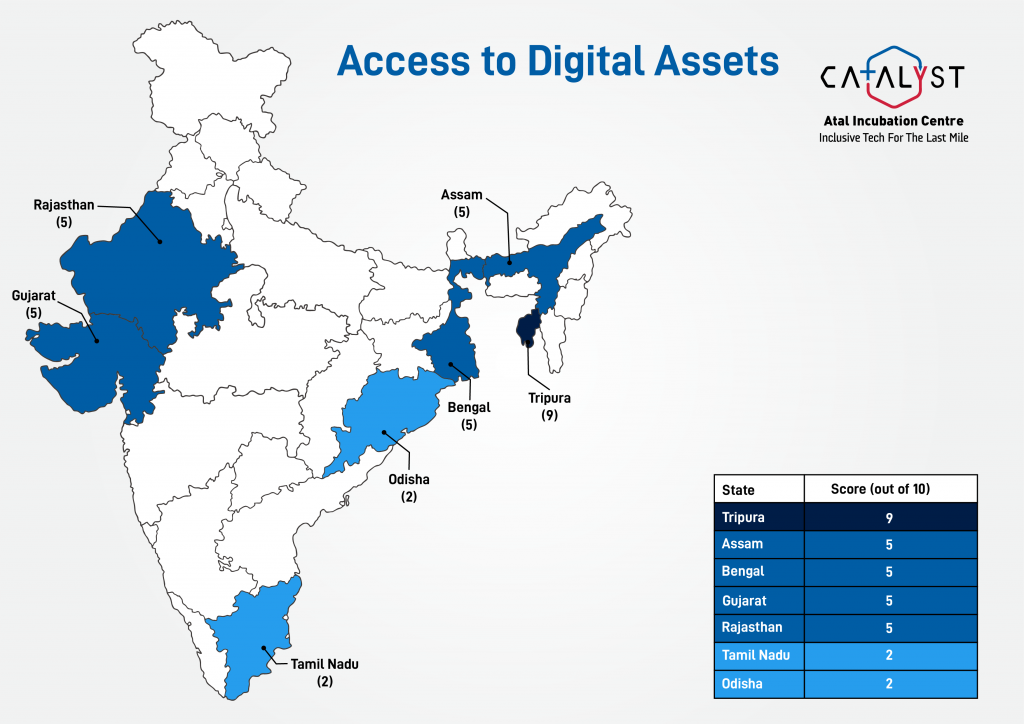
Tripura scored the highest and Assam,Bengal,Gujarat and Rajasthan as average performers.
-The sub-index provides an insight into the digital ecosystem of the artisans. (Assumption: A higher usage of internet in terms of horse translates to better and adept users of internet and hence digital platforms).
– The general browsing habits of the artisans in the study shows that 44.4% of the artisans used most of the applications in English.
-71% of the artisans use “search bar” in their mobile phones.
-The artisans have been spending substantial amounts of time browsing the internet, which could be tapped as an opportunity towards utilising the digital platforms towards business related activities.
Sub-index III: Use of Digital Channels
(A higher score was allocated to artisans who had data points falling under preferable categories.)
1)Number of digital applications used
Preferable:A higher score for artisans using maximum options out of:
YouTube, WhatsApp, Instagram, Facebook, Payment Apps such as GooglePay, PayTM, PhonePe, e-commerce applications
2) Whatsapp communication
Preferable: A higher score for artisans using maximum options out of:
a)Friends & Family
b)Clients – Final Customers (B2C), Business related partners
c)To receive information about government schemes.
3) Facebook
Preferable: Access to Facebook marketplace for their products.
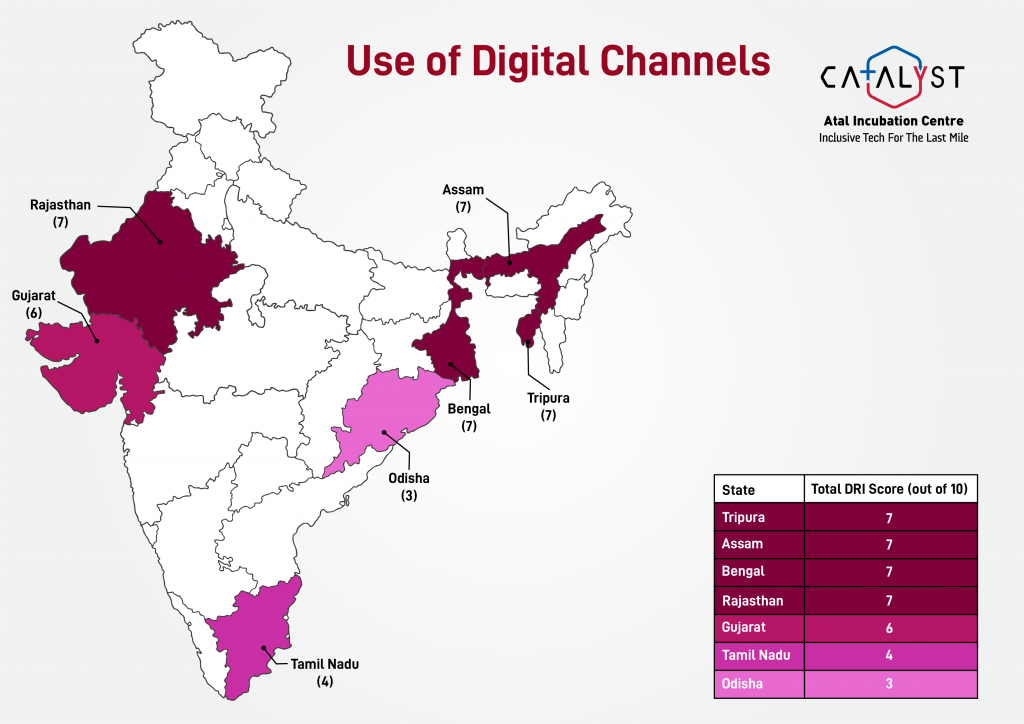
Assam, Bengal, Rajasthan, Tripura as best performers.
- A higher score has been assigned to artisans who were using whatsapp for all three segments: personal use, connecting with final customers and clients, for receiving government scheme information.
- The insight that 41.73% of the artisans using whatsapp to communicate with Final customers and 21.29% used it for reaching out to business related partners, confirms that whatsapp is a popular platform amongst the artisans but needs a larger push to be adopted for wider business related communications and connect with potential buyers for negotiating a sale.
- The study also tried to understand if there are whatsapp groups for artisans living in the same neighbourhood or if artisans are more of not so co-dependent entities. 17.27% said that they were a part of artisan’s whatsapp group.
- Information dissemination for government schemes and fairs and exhibitions by private players in this field can be publicised using whatsapp groups. A similar initiative is followed by the National Rural Livelihood Mission(NRLM) in case of fairs organised annually.
- In case of facebook, we see two very interesting observations:
-
- i) 51% of the artisans used facebook, amongst which only 9 % of them accessed facebook marketplace for their products.
- ii) 37.52% of women artisans use facebook as against men(9%).
-
Re-evaluating the sub-index III: Use of Digital Channels
(A higher score was allocated to artisans who had data points falling under preferable categories.)
1)Number of digital applications used
Preferable: YouTube, WhatsApp, Instagram, Facebook, Payment Apps such as GooglePay, PayTM, PhonePe
e-commerce applications
2) Whatsapp communication
Preferable: Friends & Family, Clients – Final Customers (B2C), Business related partners, To receive information about government schemes.
3) Facebook
Preferable: Access to Facebook marketplace for their products.
4)Instagram
Preferable: a)Having instagram page for business
b)Frequently uploading pictures/videos of their products
c)Using instagram reels feature to showcase
d)Been able to sell products through instagram
5)E-commerce applications
Preferable: Have been able to create an account on an ecommerce platform.
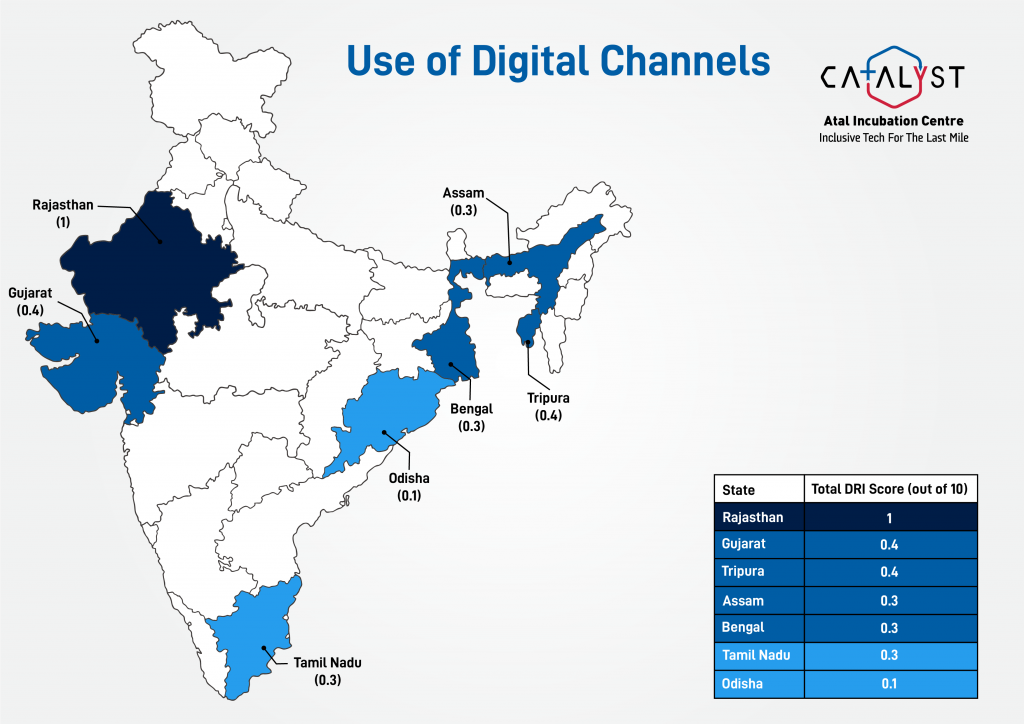
- On including the two parameters: usage of instagram and e-commerce platforms by the artisans, there was a sharp drop in the score for all the states in case of sub-index: Use of digital channels. Rajasthan is noted as the top performer, indicating a higher usage of Instagram and e-commerce.
- 11% of the artisans in the study used instagram and 2.31% used e-commerce. The artisans prefer bulk orders and there is scepticism about the number of sales online marketplaces would generate for their products.
- Onboarding the artisans onto the e-commerce platform is the most crucial step. The trust network established with SHGs can be leveraged to onboard the artisans. Guidance and training programmes to help artisans with the complete understanding of the seller account features can help achieve the goal of exposing artisans to using online marketplace independently. A subsidised referral fee where the seller (in this case the artisans) will have to pay less for selling on e-commerce can be a joint initiative by government and e-commerce players.
Sub-Index IV: Payment Mode for Business
(A higher score was allocated to artisans who had data points falling under preferable categories.)
Mode of payment
Preferable: Digital Transactions happening via :
- Debit/credit card
- Banking Apps
- UPI based digital payment apps like GooglePay, BHIM etc.
- Wallet based applications like Freecharge, AmazonPay etc.
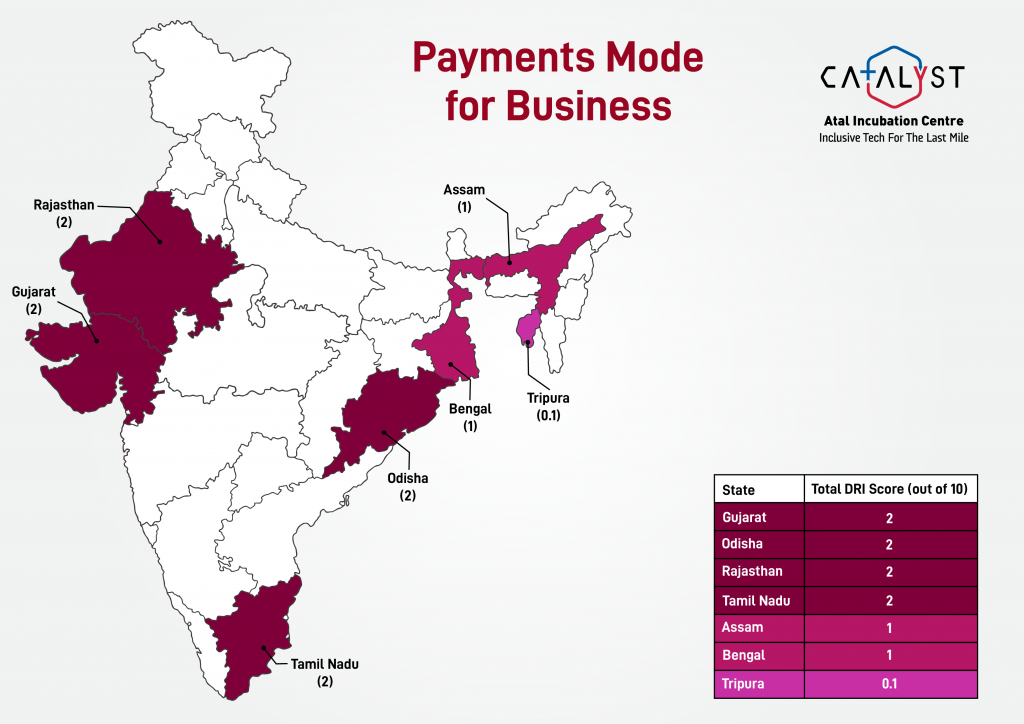
Gujarat, Rajasthan, Tamil Nadu and Odisha with highest scores
- 4.72% of the artisans used banking applications and 23% used UPI based digital payment applications.
- There is a general preference amongst the artisans for cash based transactions. An analysis of reasons behind opting mostly for cash based transactions reflects that it is more of a convenience factor amongst the artisans rather than operational barriers.
A gendered lens to Digital Readiness Index
| Men artisans | Women artisans | |
| 1)Artisanal Capabilities | 4/10 | 2/10 |
| 2)Access to Digital Assets | 5/10 | 4/10 |
| 3)Use of Digital Channels | 0.4/10 | 0.4/10 |
| 4)Payment Mode for business | 1.4/10 | 1/10 |
-The research 1.0 had highlighted that more than half of the women artisans get access through shared ownership of mobile phones. The findings were taken forward to closely study the requirements of women-led businesses.
-62% of women artisans approach their spouse/close relatives for business related advice. 12% of women as against 19% of men artisans were comfortable with online KYCs.
-Women artisans face a disproportionately higher burden of household work and hence the time poverty faced by them has to be taken into account while making any kind of policy decisions.